USD/JPY Price Analysis: Steps back from 78.6% Fibo. amid overbought RSI
- USD/JPY retreats from three-week high, snaps four-day uptrend.
- Overbought RSI, a pullback from key hurdle hints at further downside towards 61.8% Fibonacci retracement level.
- Bears remain cautious unless breaking 200-SMA support, bulls need validation from the 130.50-55 area.
USD/JPY pares intraday losses around 130.10 as bulls struggle to keep reins during Thursday’s Asian session.
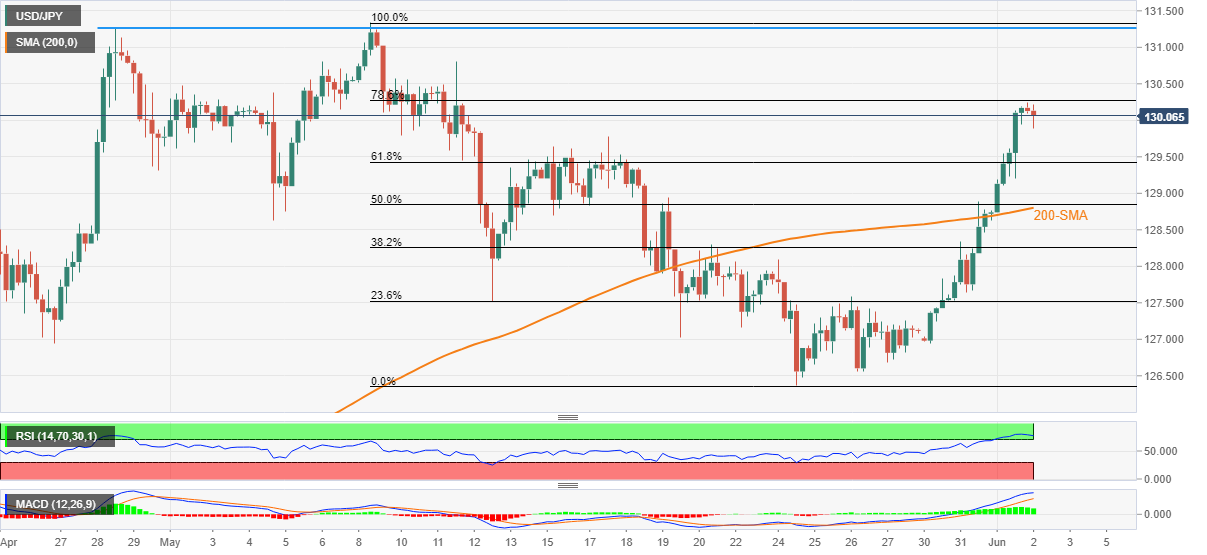
That said, the yen pair rose to the highest levels in three weeks the previous day before recently reversing from 130.23, close to the 78.6% Fibonacci retracement (Fibo.) of May 09-24 downside.
Given the overbought RSI (14) also supporting the quote’s pullback moves, USD/JPY prices may extend the latest weakness towards testing the 61.8% Fibo. level surrounding 129.40. However, a clear break of the 130.00 becomes necessary for their conviction.
In a case where the quote drops below 129.40, the 200-SMA and the 50% Fibonacci retracement level could challenge the bears around 128.80.
Meanwhile, recovery moves need to cross the immediate Fibonacci retracement level near 130.30 to recall the USD/JPY buyers.
Even so, 130.50 and the double tops marked near 131.25-30 appear tough nut to crack for the bulls.
USD/JPY: Four-hour chart
Trend: Pullback expected