NZD/USD Price Analysis: Off monthly horizontal support but not out of woods
- NZD/USD struggles to keep first intraday gains in three.
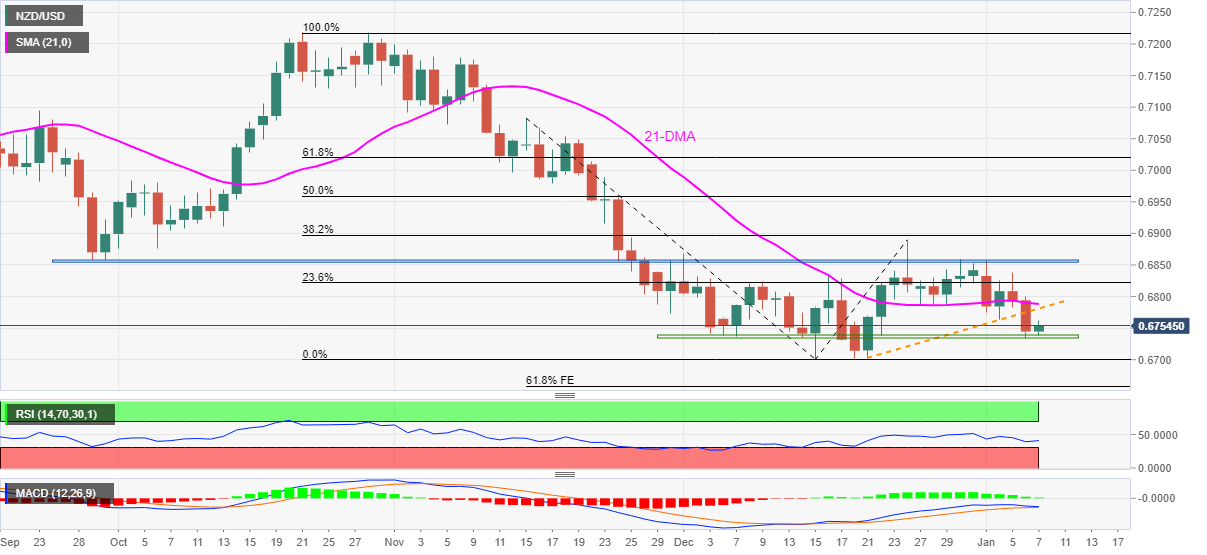
- Downside break of two-week-old trend line, 21-DMA favor sellers amid steady RSI, MACD retreat.
- Horizontal area from late September appears a tough nut to crack for bulls, 61.8% FE eyed by bears.
NZD/USD portrays a corrective pullback from short-term key support to 0.6750, up 0.12% intraday during early Friday.
In doing so, the Kiwi pair snaps a two-day downtrend near a fortnight low but stays on course to print the first weekly loss in three.
It should be noted, however, that a clear downside break of 21-DMA and a two-week-old ascending trend line joins descending RSI line, as well as receding bullish bias of the MACD, to keep NZD/USD sellers hopeful to break the immediate support zone near 0.6735-40.
Following that, the year 2021 bottom surrounding the 0.7000 threshold and 61.8% Fibonacci Expansion (FE) of the pair’s moves between November 15 and December 24, around 0.6650 will be in focus.
Alternatively, the support-turned-resistance line near 0.6775 will precede the 21-DMA level surrounding 0.6790 to limit short-term advances of the NZD/USD prices.
If the NZD/USD buyers manage to cross the 0.6790 hurdle, a 14-week-old horizontal area surrounding 0.6855-60 will challenge the NZD/USD bulls.
NZD/USD: Daily chart
Trend: Further weakness expected