EUR/GBP Price Analysis: The break of an ascending triangle in the 4-hour chart targets 0.8570
- The British pound recovered some ground against the EUR.
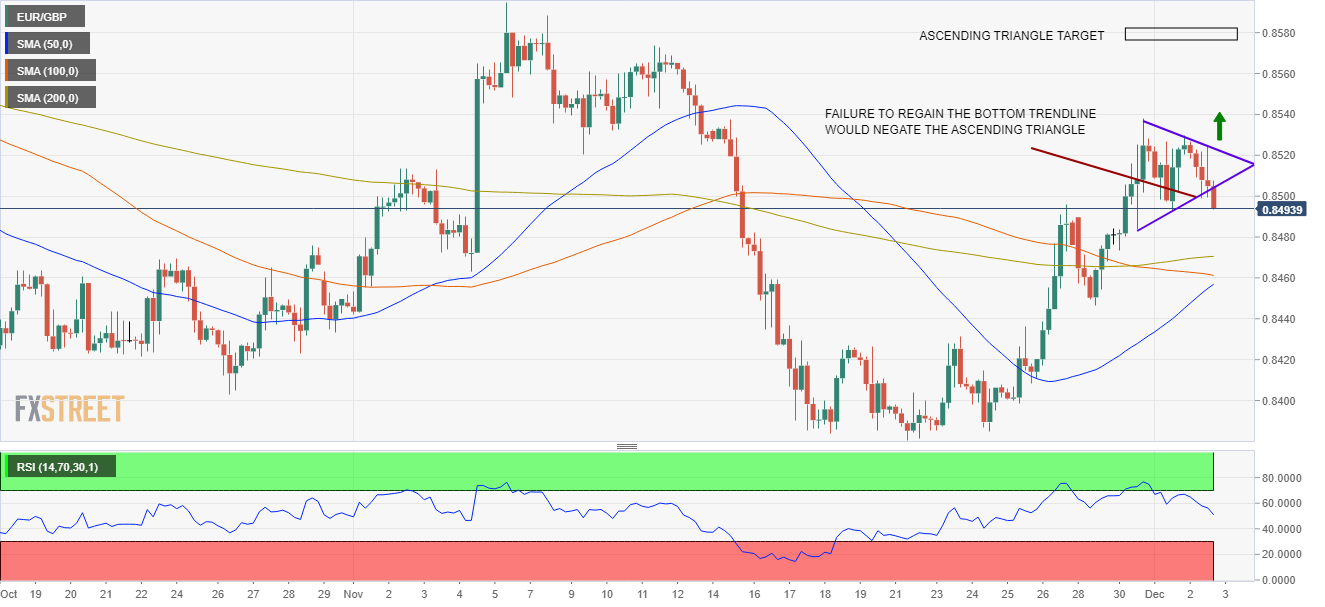
- The 4-hour chart shows the formation of an ascending triangle that would target the 0.8580-0.8580 area once broken.
The British pound has regained some strength against the shared currency, advancing after losing for five consecutive days. The EUR/GBP pair falls moderately during the New York session, down 0.36%, trading at 0.8497 at the time of writing.
In the overnight session, the EUR/GBP pair tested the December 1 high at 0.8530. However, the upward move was faded, retreating towards the S1 daily pivot at 0.8498, which coincidentally confluences with the 100-hour simple moving average. In the last couple of hours, the pair seesawed between tie 0.8490-0.8524, steady around that range.
EUR/GBP Price Forecast: Technical outlook
The EUR/GBP has an upward bias, as portrayed by the 4-hour chart. In this timeframe, the simple moving averages (SMA’s) reside below the spot price, although in disorder. From top to bottom lies the 200-SMA at 0.8468, the 100-SMA at 0.8462, and the 50-SMA at 0.8452.
Also, it is essential to notice the formation of an ascending triangle that has bullish implications, that in the outcome of breaking higher, would target 0.8570-0.8580. Nevertheless, the last candlestick, pushed lower, breaking the bottom upslope support trendline, would negate the chart pattern on the outcome of being broken.
If the EUR/GBP continues falling, it will negate the triangle formation, leaving as the first support the SMA’s confluence in the 0.8452-0.8470 range. The breach of the latter would expose the 0.8400 figure, followed by the year-to-date low at 0.8380
In the outcome of regaining the triangle-bottom-upslope trendline, the first resistance would be 0.8525. Once that level is broken, the next supply zone would be 0.8541, followed by the 0.8570-0.8580 range.