US Dollar Index Price Analysis: DXY pokes 50% Fibo. hurdle amid overbought RSI
- DXY bulls pause after two-day uptrend around 16-month high.
- Overbought RSI conditions, key Fibonacci retracement level hints at a pullback.
- 200-week SMA becomes the key support, further advances may eye August 2018 peak.
US Dollar Index (DXY) grinds higher around 95.90 during early Wednesday, after refreshing the highest levels since July 2020 the previous day.
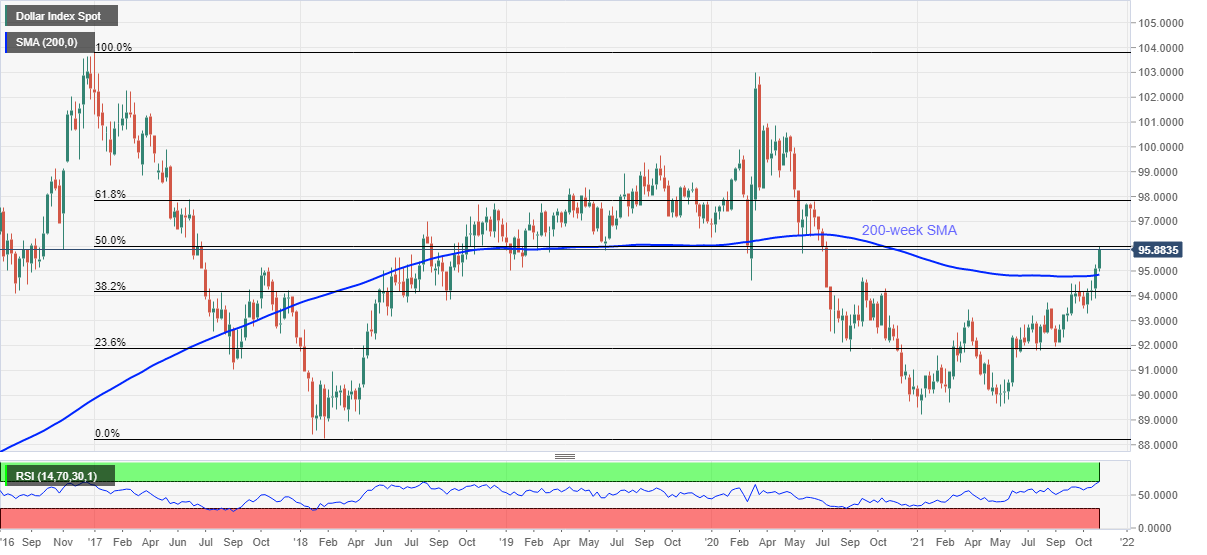
The greenback gauge’s latest halt at the multi-day top could be linked to the overbought RSI conditions and the buyers’ battle with the 50.0% Fibonacci retracement (Fibo.) of a broad downtrend from early 2017 to February 2018.
It should be noted, however, that the pullback moves may remain less important until declining back below the 200-week SMA level of 94.85.
Also acting as downside filters are the tops marked during September 2020 and October 2021, respectively around 94.75 and 94.55.
On the contrary, a clear upside break of the 96.00 Fibo. hurdle will direct the DXY bulls towards the August 2018 high near the 97.00 threshold before aiming for the 61.8% Fibonacci retracement level surrounding 97.85.
To sum up, DXY remains in the uptrend but a short-term pullback can’t be ruled out.
DXY: Weekly chart
Trend: Pullback expected