GBP/USD Price Analysis: On the way to 1.3970-80 key hurdle
- GBP/USD strays mildly bid inside a bullish chart formation.
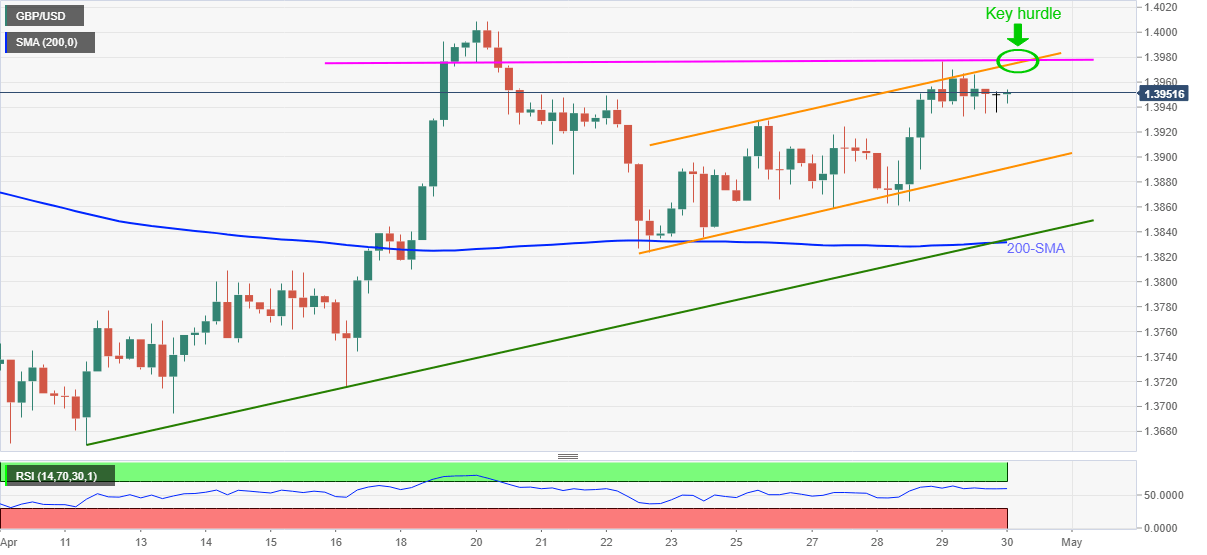
- Upper line of the short-term rising channel, two-week-old horizontal area guard short-term upside.
- Confluence of 200-SMA, ascending trend line from April 12 becomes a tough nut to crack for sellers.
- Strong RSI, ability to stay past key SMA keep buyers hopeful.
GBP/USD picks up bids to 1.3955, intraday high of 1.3958, while flashing 0.10% daily gains during early Friday. In doing so, the cable remains inside a one-week-old ascending trend channel while keeping the bounce off 200-SMA portrayed on April 22 amid upbeat RSI conditions.
However, a confluence of the stated channel’s resistance and horizontal line comprising levels marked since April 19, around 1.3975-80, becomes the key for GBP/USD buyers.
Also likely to challenge the quote’s upside is the 1.4010-20 area comprising highs marked in March and so far in April.
Alternatively, pullback moves may target 1.3930 but shouldn’t be considered challenging the bullish trend until breaking the channel’s support line, around 1.3890.
It should be noted that a convergence of 200-SMA and short-term rising support line near 1.3830 will be a strong level to watch past-1.3890.
GBP/USD four-hour chart
Trend: Bullish