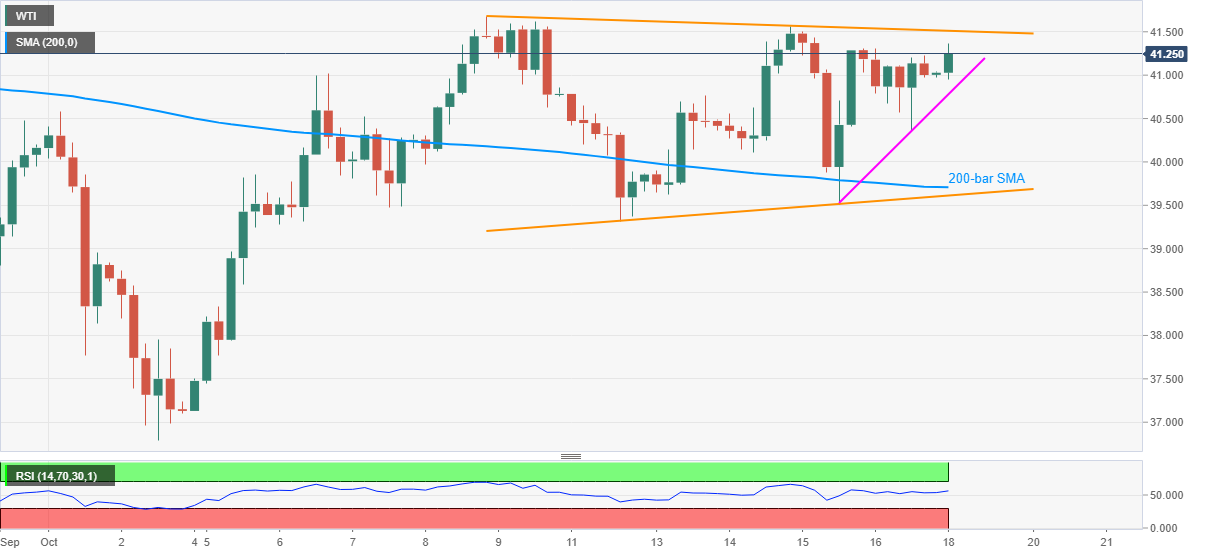
WTI Price Analysis: Bulls again aim to cross $41.50 key resistance
- WTI buyers attack upper line of a seven-day-old symmetrical triangle.
- Sustained trading beyond 200-bar SMA, normal RSI favor buyers.
- A two-day-long rising trend line offers immediate support.
WTI prints mild gains of 0.50% while trading near $41.25 ahead of Monday’s Tokyo open. In doing so, the energy benchmark again tries to provide a bullish breakout to the triangle formation established from October 08.
Considering the normal RSI conditions and the quote’s ability to rise in the last two days, as per the immediate rising trend line, buyers are likely to cross the $41.50 immediate resistance.
Following that, September 04 high near $42.10 holds the key to the commodity’s further upside towards the late-August lows surrounding $43.50.
Alternatively, a downside break of the nearby support line, at $40.78 now, can recall sellers to attack the $39.70-60 support zone comprising 200-bar SMA and the triangle’s support.
In a case where the oil prices slip below $39.60, the $39.00 round-figure and the monthly low near $36.80 could be WTI sellers’ favorites.
WTI four-hour chart

Trend: Further recovery expected
