EUR/USD Price Analysis: Under pressure in Asia, bearish divergence on 1H
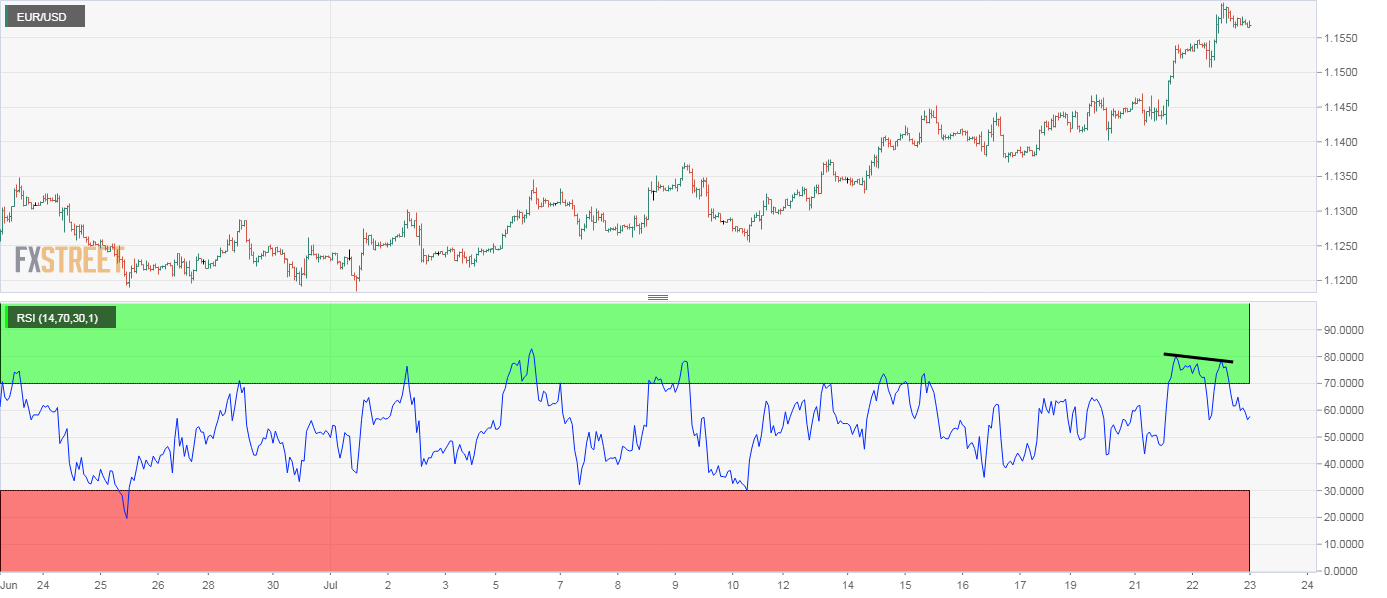
- EUR/USD's hourly chart shows a bearish RSI divergence.
- Daily chart RSI hovers above 70.00 in overbought territory.
EUR/USD is trading in the red near 1.1565 during Thursday's Asian trading hours, having faced rejection at 1.1602 on Wednesday.
The pullback may be extended further to levels below 1.1550, as the relative strength index (RSI) is reporting an overbought condition on the daily chart and bearish divergence on the hourly chart.
A bearish divergence occurs when an indicator charts lower highs as opposed to higher highs on price and is considered an early warning of bearish reversal.
The outlook as per the daily chart would remain bullish as long as the pair is holding above the ascending 10-day simple moving average at 1.1437. Meanwhile, as per the weekly chart, the 200-week SMA, currently at 1.1335, is the level to beat for the sellers.
Hourly chart
Trend: Deeper pullback likely
Technical levels