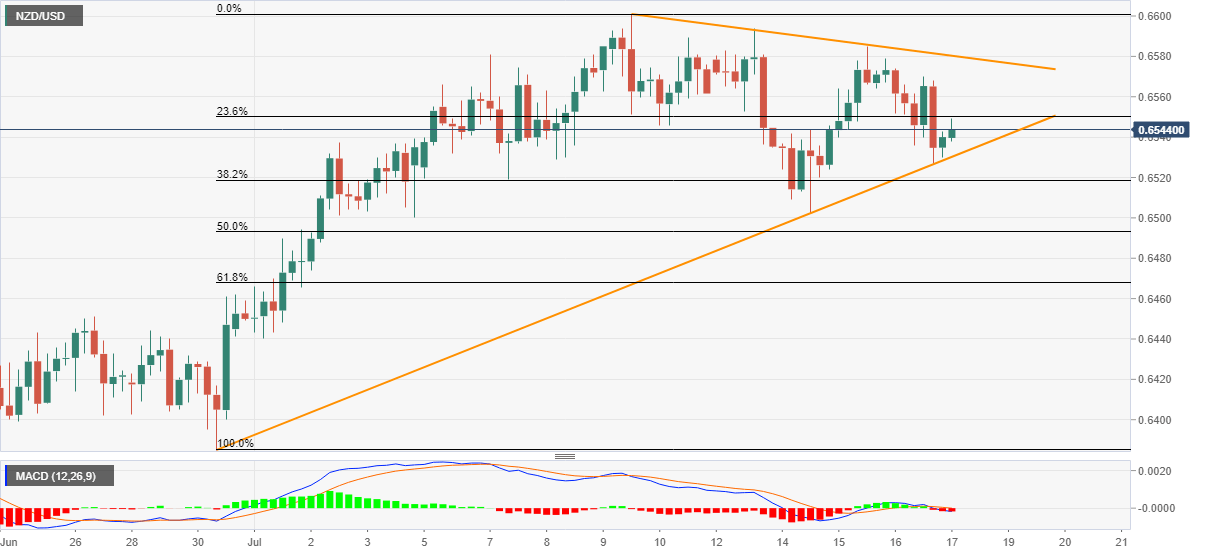
NZD/USD Price Analysis: Extends recovery moves from monthly support line
- NZD/USD defies the previous day’s declines while printing 0.10% gains.
- An upward sloping trend line from June 30 holds the gate for the fall towards the key Fibonacci retracement levels.
- A one-week-old resistance line guards the near-term upside.
NZD/USD seesaws around 0.6540 during the early Friday’s trading. In doing so, the kiwi pair keeps its pullback moves from the short-term support line. It’s worth mentioning that the quote dropped heavily the previous day.
Hence, buyers might aim to refresh the monthly top near 0.6600. However, bearish MACD and nearby falling trend line, currently around 0.6580, questions the bulls.
If at all the NZD/USD prices cross all odds to and remain firm past-0.6600, the mid-January month high near 0.6665 could gain the market’s attention.
Alternatively, the pair’s declines below the adjacent support line, at 0.6530, can attack 50% Fibonacci retracement of June 30 to July 09 upside, at 0.6493.
Should bears refrain from stepping back, 61.8% Fibonacci retracement level of 0.6467 and June 26 high of 0.6451 will flash on their radars.
NZD/USD four-hour chart

Trend: Further recovery expected
