USD/IDR Price News: Indonesian rupiah struggles to keep recovery moves
- USD/IDR snaps two-day recovery moves, steps back from 100-bar SMA.
- 61.8% of Fibonacci retracement limits immediate downside.
- An eight-day-old falling trend line adds to the support.
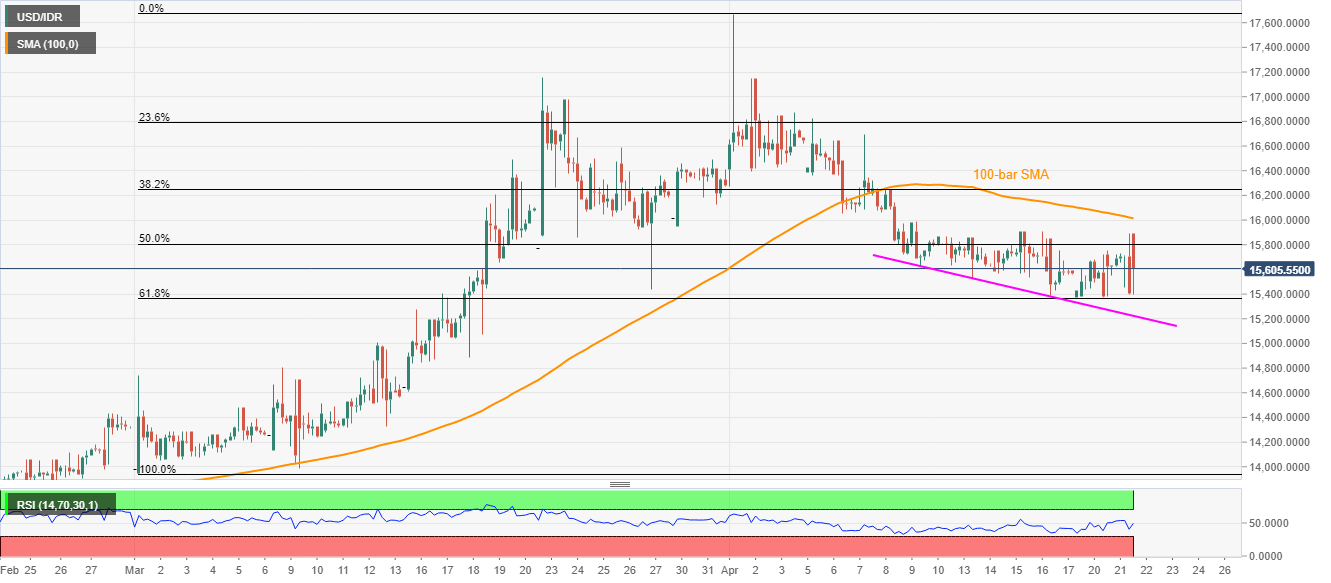
USD/IDR drops to 15,597, down 0.70% on a day, during the pre-European trading session on Wednesday. In doing so, the pair pulls back from 100-bar SMA but stays above 61.8% Fibonacci retracement of the quote’s rise from March 02 to April 01.
In addition to the key technical levels, normal conditions of RSI also portray the pair’s sideways momentum.
As a result, the USD/IDR prices are less likely to register a noticeable move unless either crossing 16,015 SMA resistance or declining below 15,360 figures comprising 61.8% Fibonacci retracement level.
Also adding to the support side is a downward sloping trend line from April 10, currently near 15,220.
While an upside break of 16,015 could escalate the pair’s recovery moves towards 16,450 and 16,900 numbers to the north, a sustained decline below 15,220 can recall mid-March lows surrounding 14,900.
USD/IDR four-hour chart
Trend: Sideways