Back
5 Dec 2019
GBP/USD price analysis: Unstoppable Pound challenges the 1.3150 level
- The cable remains strongly bullish while trading at seven-month highs.
- The level to beat for bulls is the 1.3150 resistance.
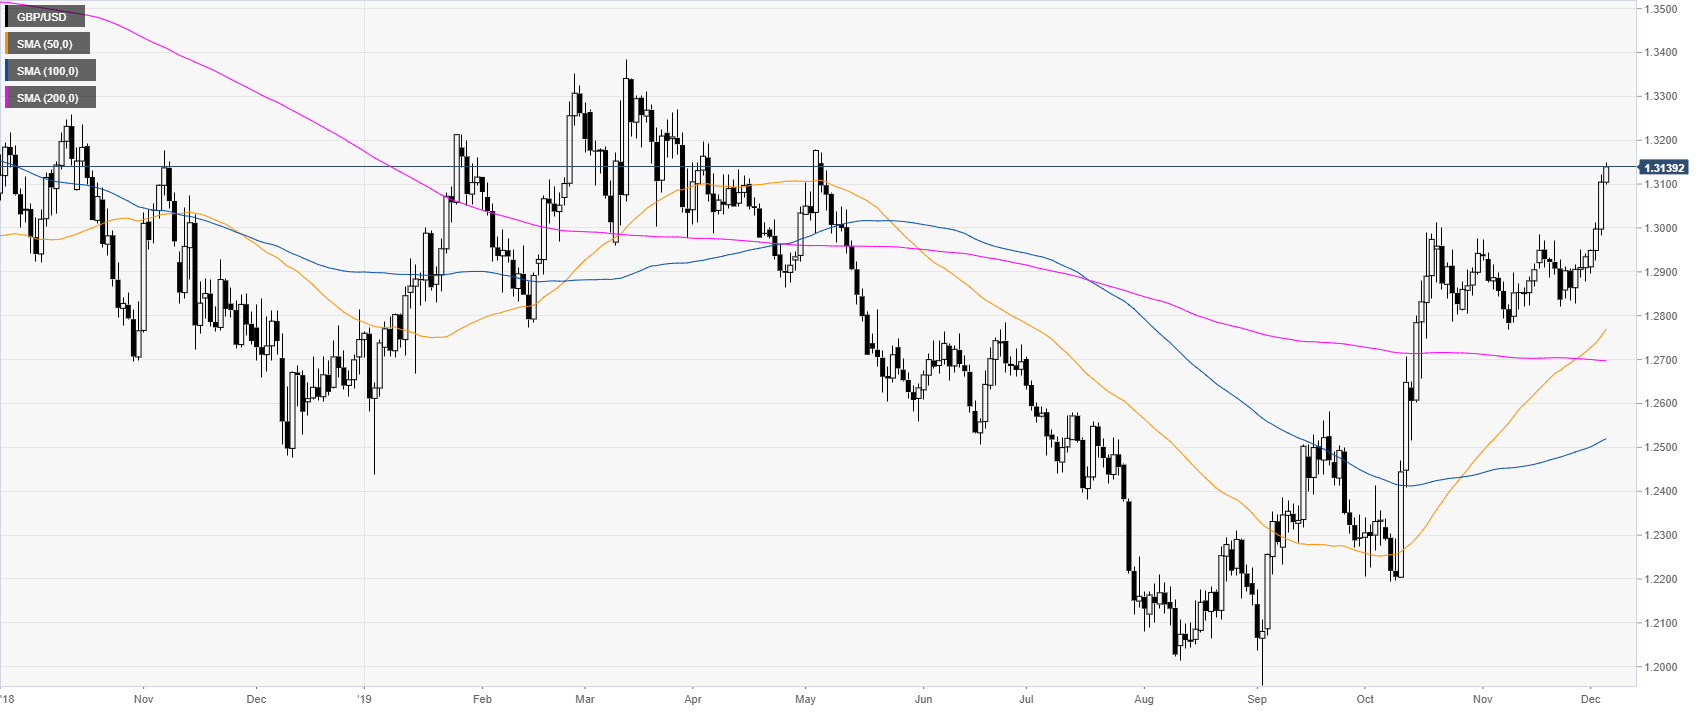
GBP/USD daily chart
After November’s consolidation, the market eventually broke to the upside climbing to levels not seen since early May of this year.
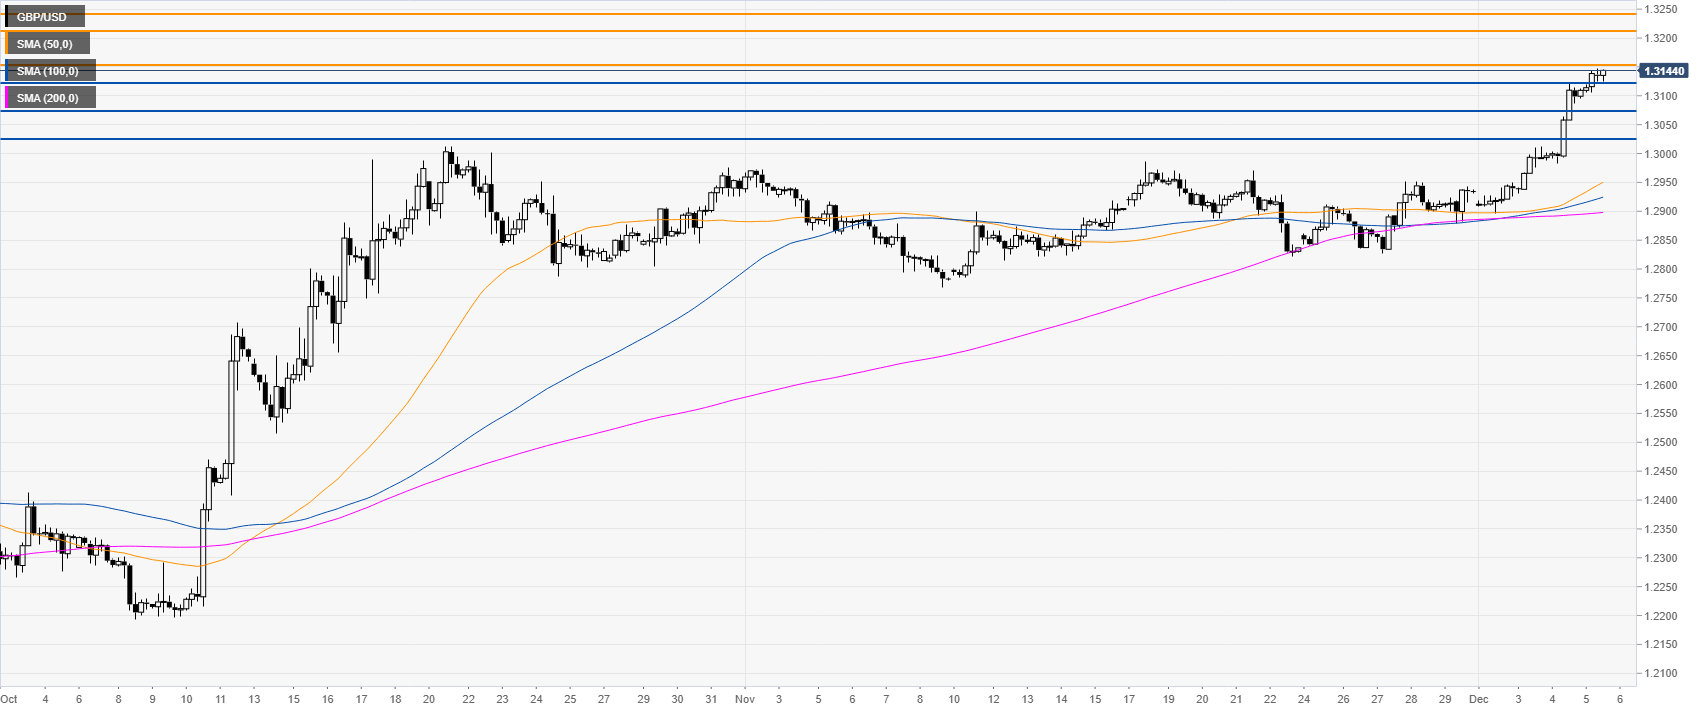
GBP/USD four-hour chart
The market is rising sharply to the upside while above its main simple moving averages (SMAs). As the buyers remain in full in control, the spot will likely attempt to break the 1.3150 resistance. The next levels on the way up are seen at the 1.3211 and 1.3243 levels, according to the Technical Confluences Indicator.
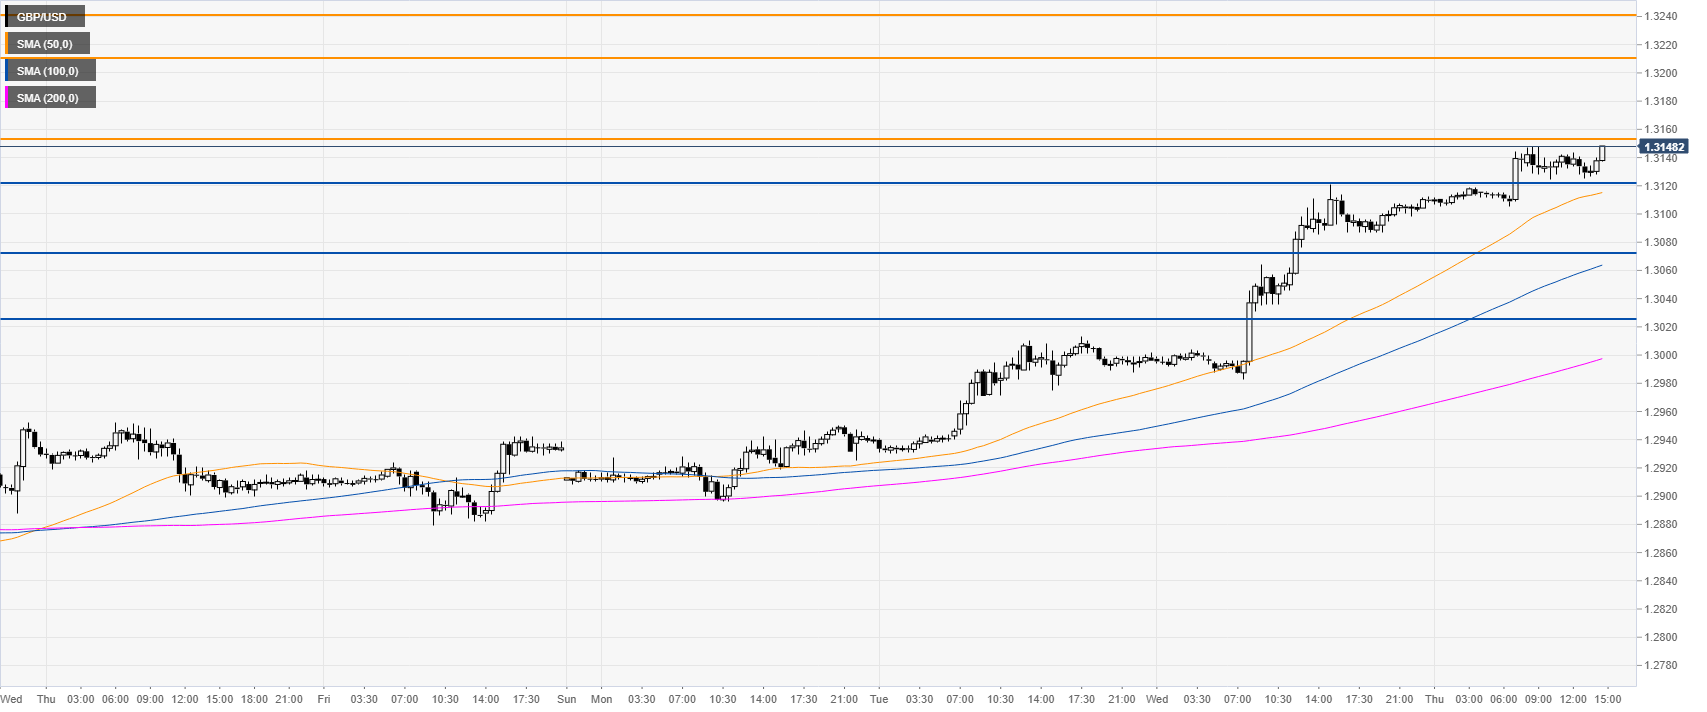
GBP/USD 30-minute chart
GBP/USD is evolving above the main SMAs. Support is seen at the 1.3122, 1.3074 and 1.3026 price levels.
Additional key levels