Back
7 Nov 2019
AUD/USD Technical Analysis: 100-day EMA limits downside risk
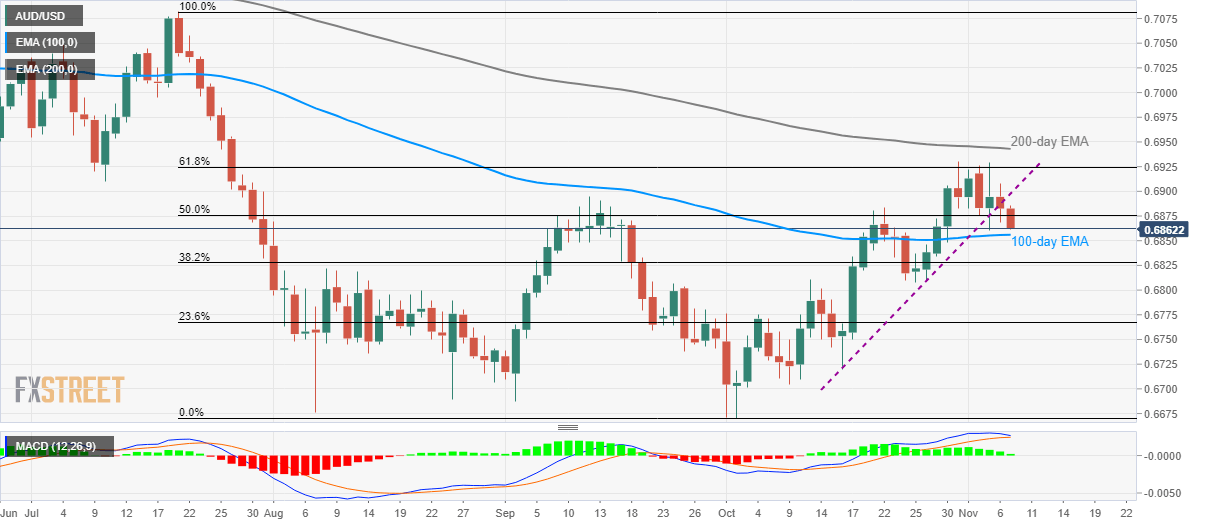
- AUD/USD nears six-day low after breaking the three-week-old rising trend line.
- 61.8% Fibonacci retracement, 200-day EMA restricts near-term upside.
Following its break of a three-week-old ascending support line, AUD/USD slips to 0.6868 during early Thursday.
However, 100-day Exponential Moving Average (EMA), around 0.6856 now, stands tall to question pair’s further declines, if not then an extended downpour to 0.6810/05 area comprising October 25 low and late-September tops.
On the upside, pair’s recovery needs to cross the support-turned-resistance line, at 0.6900 now, in order to again confront 61.8% Fibonacci retracement level of 0.6925 and 200-day EMA level of 0.6945.
That said, the pair’s sustained rise above 0.6945 enables it to challenge 0.7000 round-figure and July month high close to 0.7085.
AUD/USD daily chart

Trend: Recovery expected
