Back
18 Oct 2019
EUR/USD technical analysis: Euro clings to weekly gains after the London close
- The Greenback weakness is pushing EUR/USD to the 1.1160 level after the London close.
- The level to beat for buyers is 1.1160, followed by the 1.1191 level.
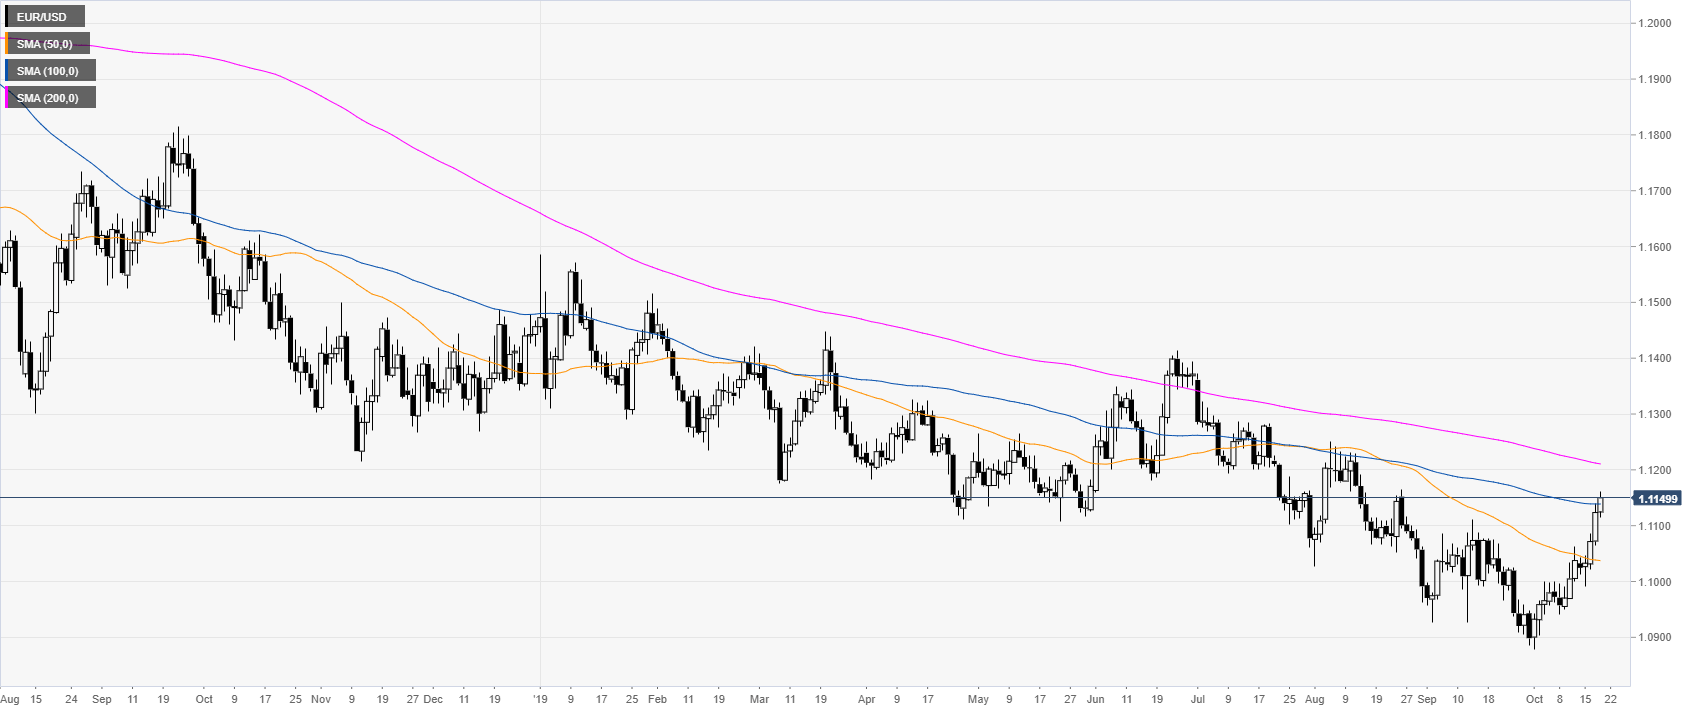
EUR/USD daily chart
On the daily chart, the single currency is trading in a bear trend below the 200-day simple moving averages (DSMAs). However, this Friday, the Fiber broke above the 100 DSMA, today at 1.1138.
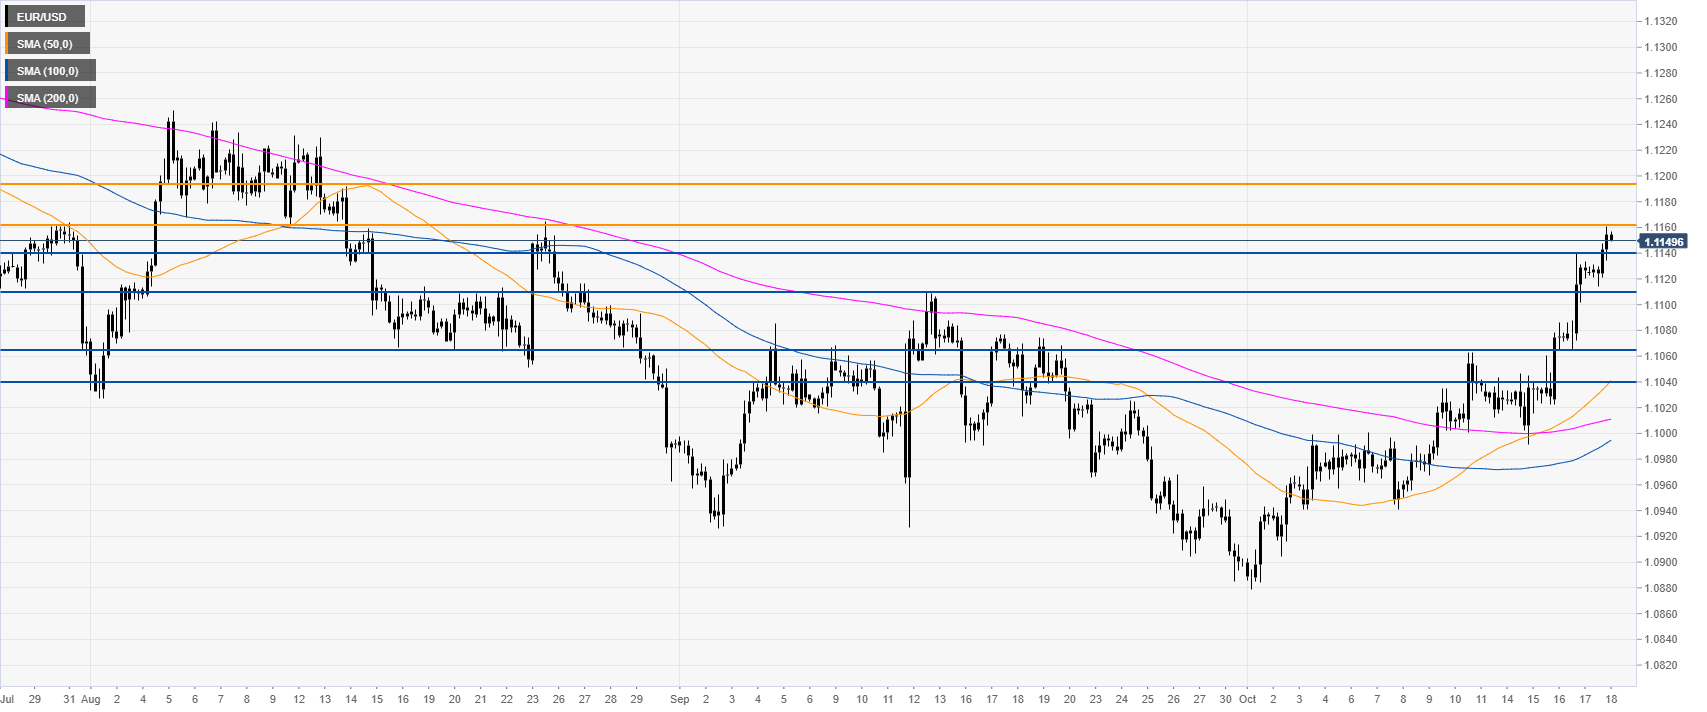
EUR/USD four-hour chart
The Euro is trading above the main SMAs, suggesting bullish momentum in the medium term. EUR/USD is clinging to October highs while trading above September highs. A breakout above 1.1160 resistance could open the gates to the 1.1191 resistances on the way up, according to the Technical Confluences Indicator.
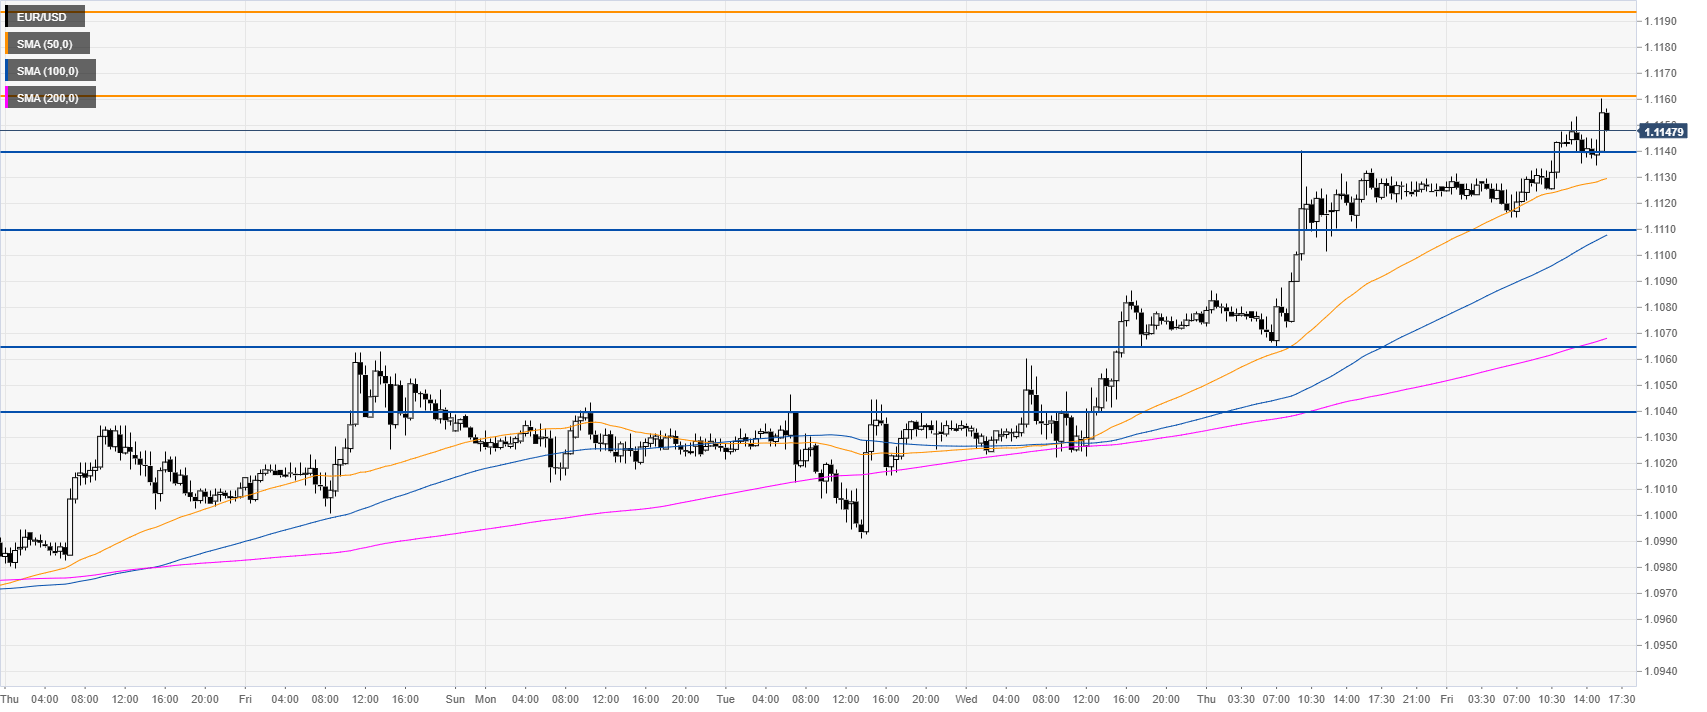
EUR/USD 30-minute chart
EUR/USD is trading above the main SMAs, suggesting bullish momentum in the near term. Support can be seen at the 1.1140 and 1.1110 price levels.
Additional key levels