Back
17 Sep 2019
GBP/USD technical analysis: Cable challenging the 1.2425 resistance in the New York session
- The Sterling has been correcting on Monday and early Tuesday to the 1.2400 support zone.
- This Tuesday the market is in search of direction as the 1.2425 is likely an important resistance to watch for.
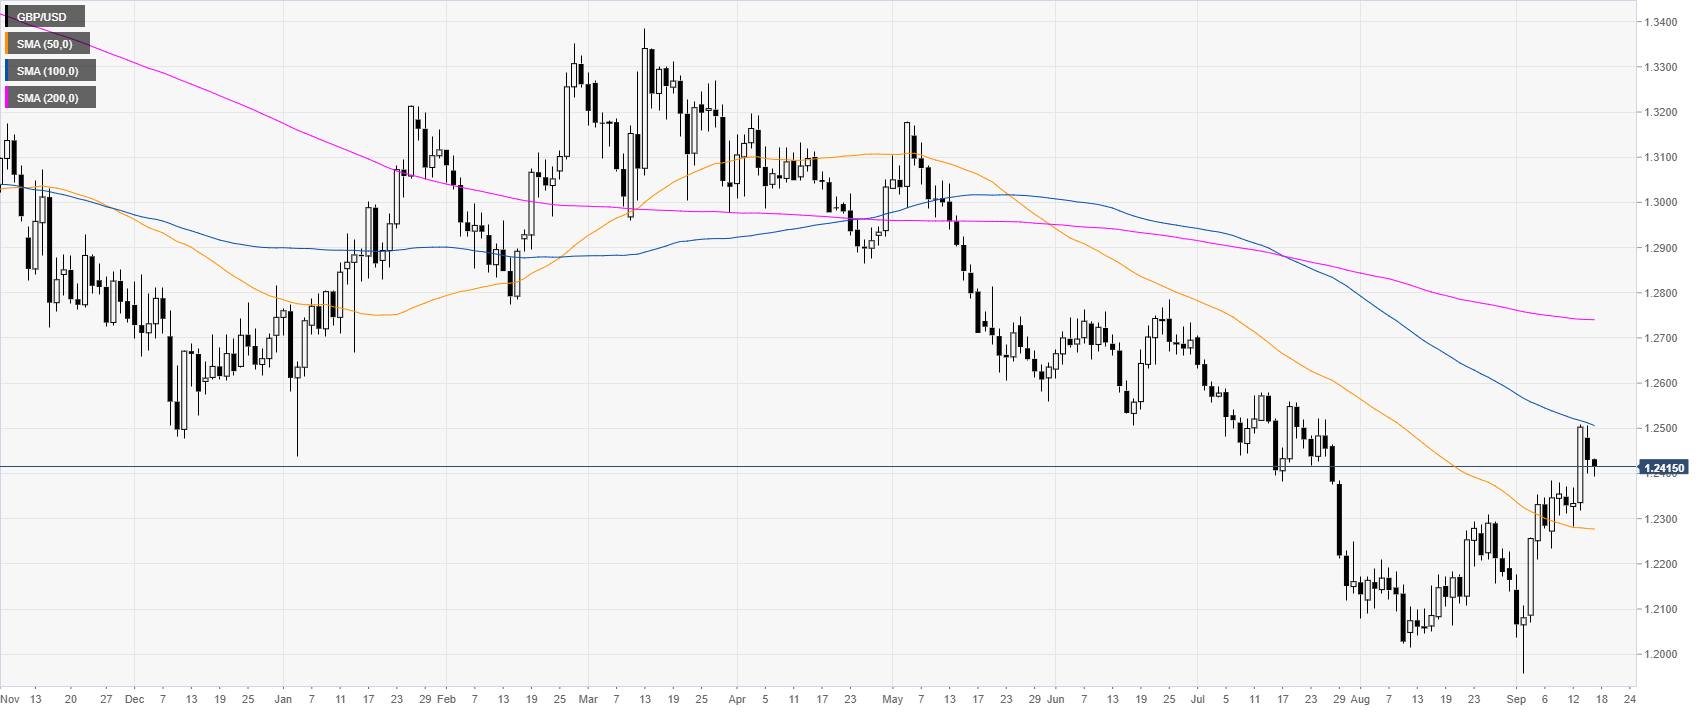
GBP/USD daily chart
The Pound is trading in a bear trend below the 100 and 200-day simple moving averages (SMAs). However, in September, GBP/USD has been rebounding sharply to the 1.2500 handle and the 100 SMA.
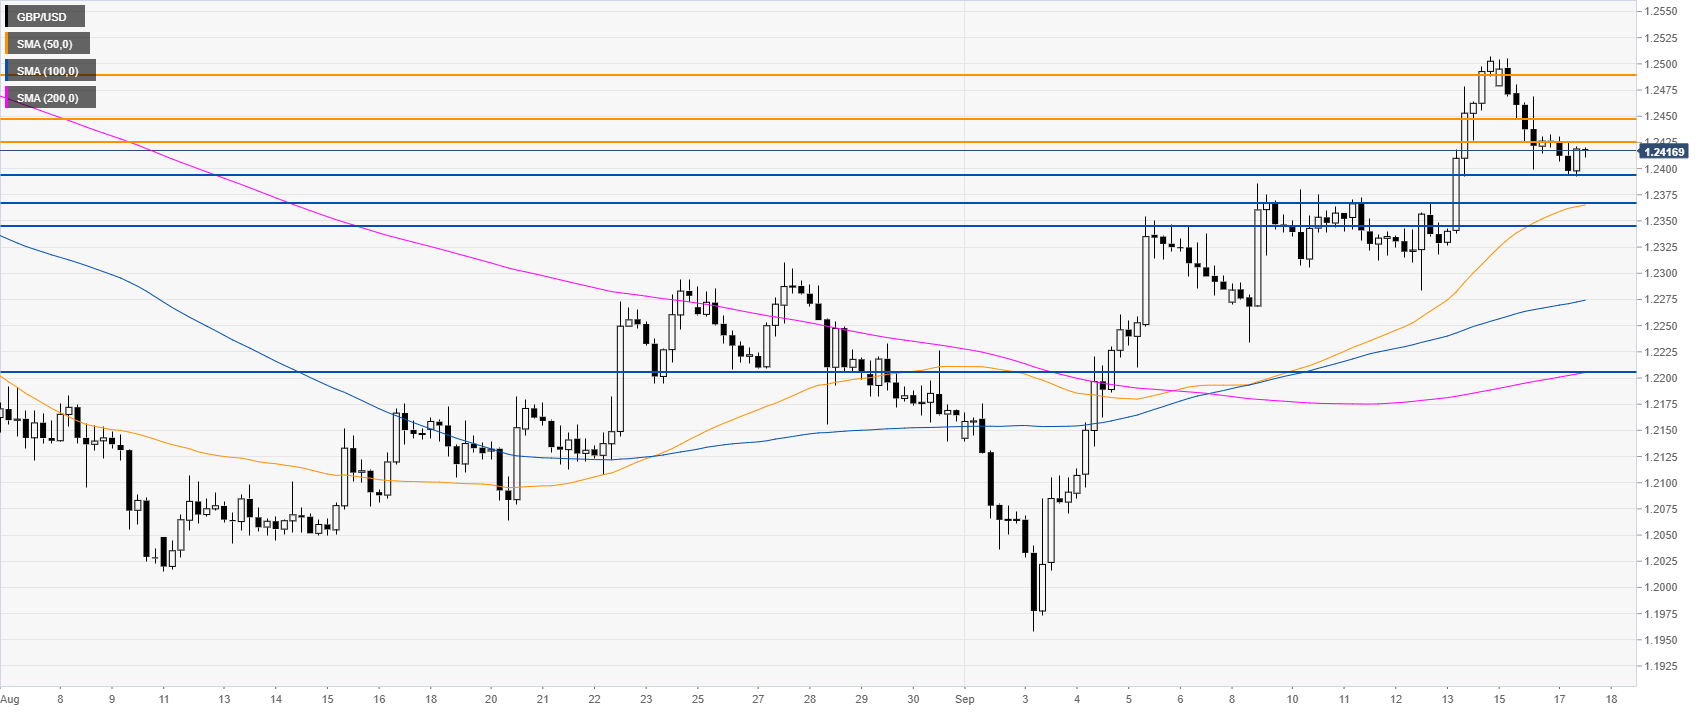
GBP/USD four-hour chart
The Pound is trading above the main SMAs, suggesting bullish momentum in the medium term. Buyers are trying to base near the 1.2400 level. The first hurdle is the 1.2425 resistance. If broken the next resistances can be seen at 1.2448 and 1.2487 according to the Technical Confluences Indicator.
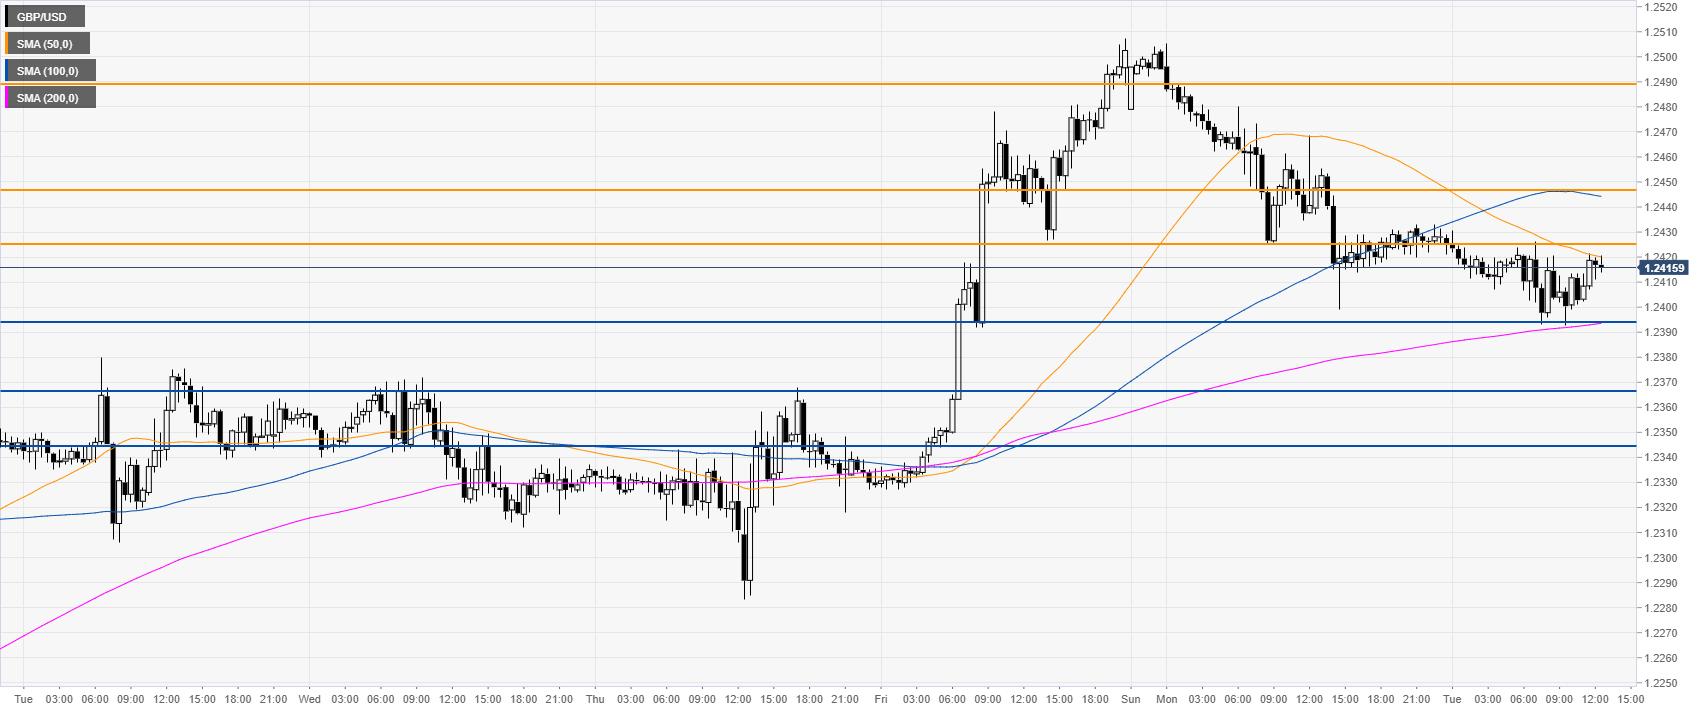
GBP/USD 30-minute chart
The Sterling is trading between the 50 and 200 SMA suggesting a consolidation in the near term. It will be interesting to see if the bulls can reclaim the 1.2425 resistance. In case they can’t, the market might probe the 1.2395 support. If this level gets breached, bears could set their eyes on the 1.2365 and 1.2344 price levels according to the Technical Confluences Indicator.
Additional key levels