AUD/USD Technical Analysis: Aussie declining towards the 0.7150 level
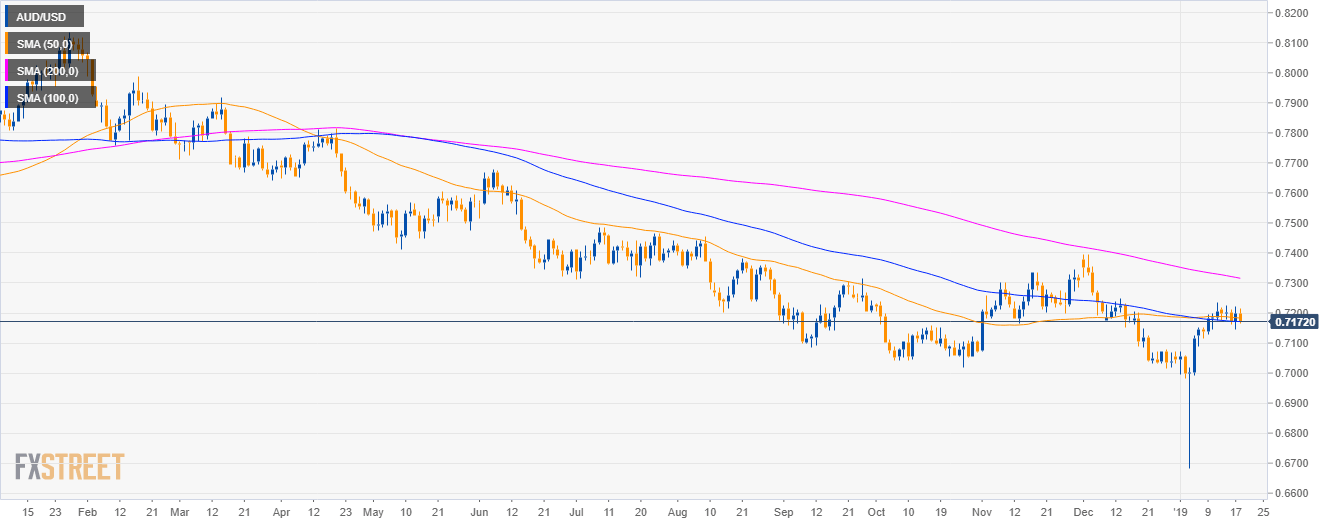
AUD/USD daily chart
- AUD/USD is in a bear trend below the 200 SMA.
- AUD/USD is coiling near the 50 and 100 SMAs.
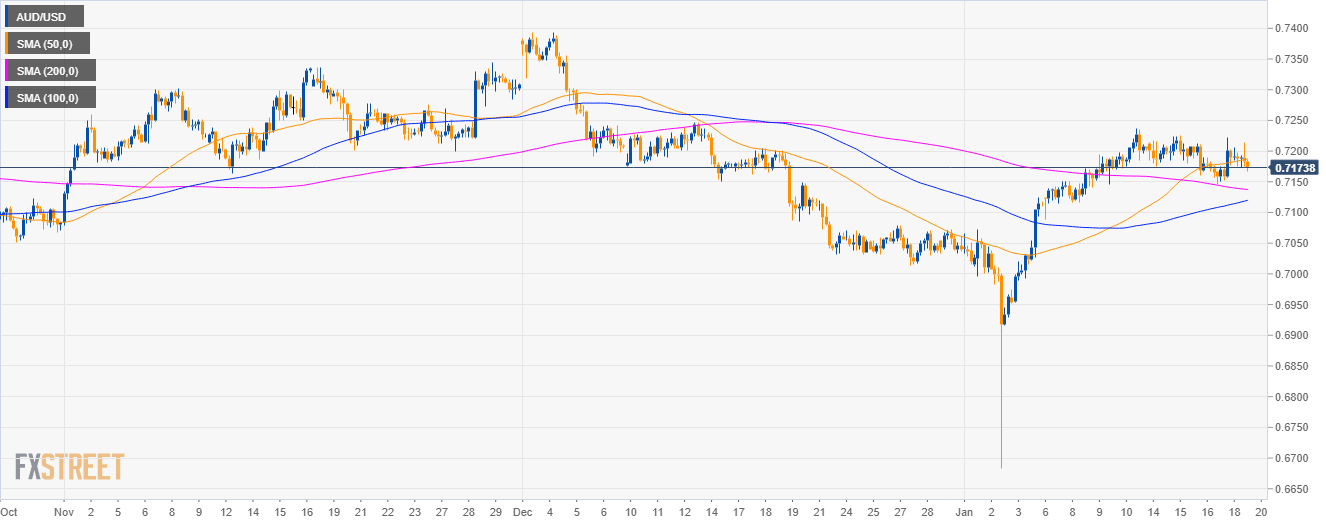
AUD/USD 4-hour chart
- AUD/USD bulls are trading above the 100 and 200 SMAs.
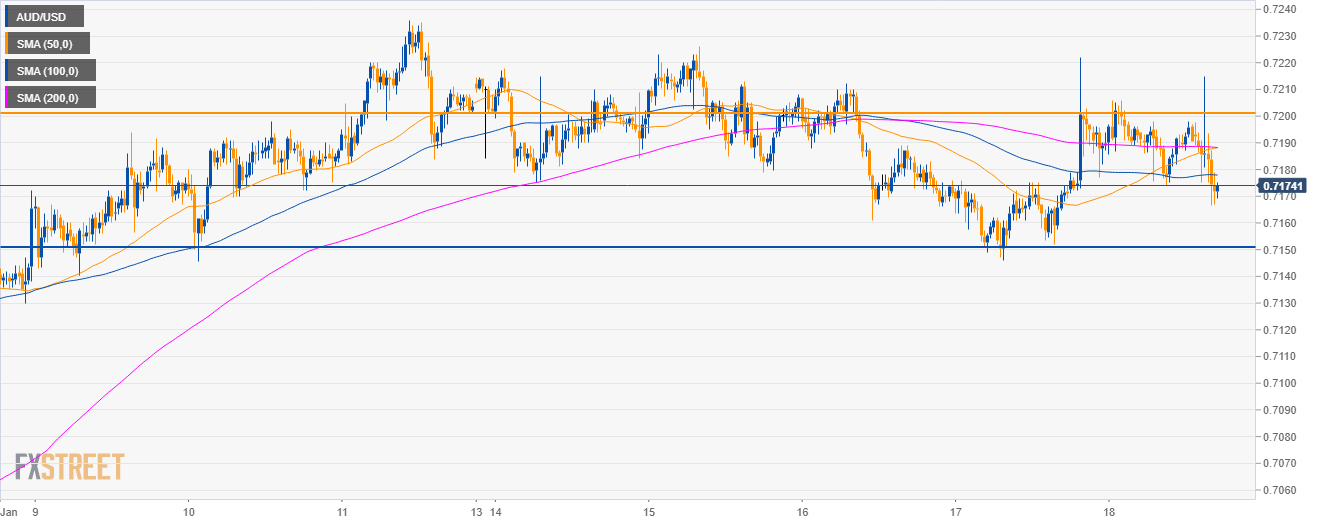
AUD/USD 30-minute chart
- As bears are gaining momentum below the 200 SMA, a mild decline to the 0.7150 level is most likely on the cards.
Additional key levels
AUD/USD
Overview:
Today Last Price: 0.7174
Today Daily change: -0.0023 pips
Today Daily change %: -0.32%
Today Daily Open: 0.7197
Trends:
Daily SMA20: 0.7105
Daily SMA50: 0.7184
Daily SMA100: 0.7172
Daily SMA200: 0.732
Levels:
Previous Daily High: 0.7222
Previous Daily Low: 0.7146
Previous Weekly High: 0.7236
Previous Weekly Low: 0.7089
Previous Monthly High: 0.7394
Previous Monthly Low: 0.7014
Daily Fibonacci 38.2%: 0.7193
Daily Fibonacci 61.8%: 0.7175
Daily Pivot Point S1: 0.7155
Daily Pivot Point S2: 0.7112
Daily Pivot Point S3: 0.7079
Daily Pivot Point R1: 0.7231
Daily Pivot Point R2: 0.7264
Daily Pivot Point R3: 0.7307