Back
23 Jul 2018
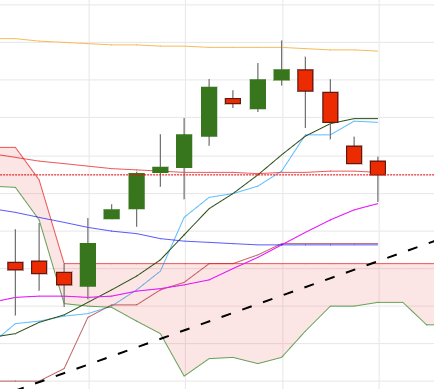
EUR/JPY Technical Analysis: support found at the 21-day SMA just around 129.90.
- The cross is prolonging the leg lower for the fourth consecutive session today, coming down after hitting tops in the 132.00 neighbourhood earlier in the month albeit meeting decent support in the 129.90/85 band, where sits the 21-day sma.
- In spite of the correction lower, the constructive bias surrounding the cross remains unchanged while above the daily cloud. This view stays underpinned by the immediate support line off 2018 lows recorded in late May.
- As long as this area around 129.10/15 band holds, another visit to the 132.00 area should not be ruled out.
- Furthermore, the daily RSI reads 52, while the ADX at 17suggests the current trend is weak (absent).
EUR/JPY daily chart
Daily high: 130.75
Daily low: 129.86
Support Levels
S1: 130.33
S2: 130.09
S3: 129.64
Resistance Levels
R1: 131.03
R2: 131.48
R3: 131.73