AUD/NZD Price Prediction: Three Black Crows reversal pattern a bearish omen
- AUD/NZD has confirmed a bearish reversal pattern after peaking in late November.
- The MACD has crossed below its signal line providing a sell signal.
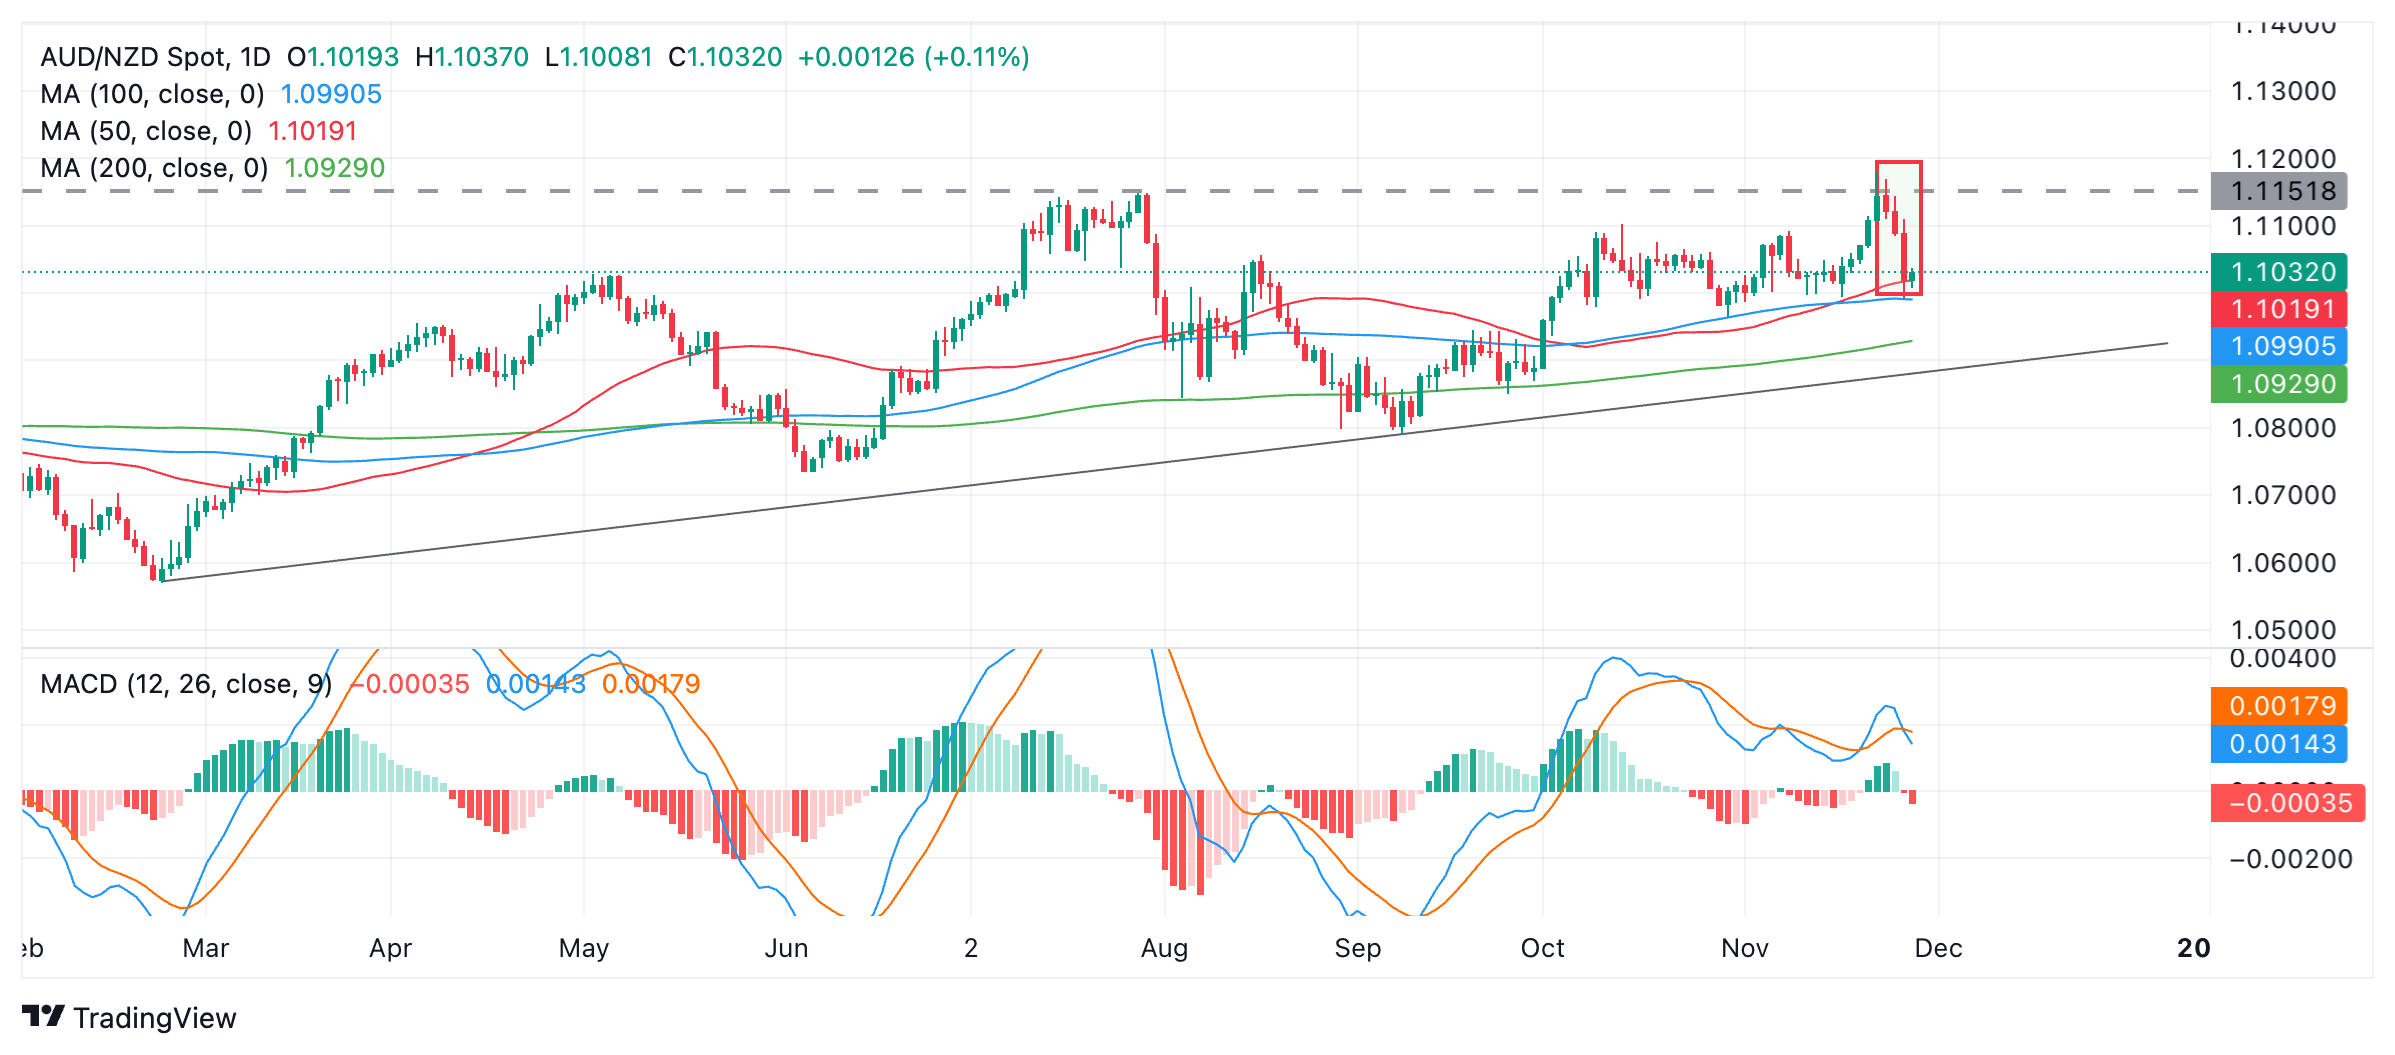
AUD/NZD has completed a Three Black Crows candlestick pattern (red rectangle on chart) after peaking at the November 25 multi-month high.
AUD/NZD Daily Chart
The Three Black Crows is a Japanese candlestick pattern which occurs after a market peak, when three red down days occur consecutively. Such a pattern indicates the odds favor AUD/NZD moving to lower lows.
The (blue) Moving Average Convergence Divergence (MACD) has crossed below its red signal line, giving a sell signal and reinforcing the bearish candlestick pattern.
Support lies first at the 200-day Simple Moving Average (SMA) at 1.9029 and then at the trendline for the broader uptrend at around 1.0900.
A break below the low of the Three Black Crows at 1.0992 would confirm a continuation to the above-mentioned targets.

