AUD/USD Price Analysis: Key resistance line, overbought RSI tease pullback toward 0.6820
- AUD/USD bulls attack downward-sloping resistance line from April 2022.
- Overbought RSI, light calendar challenge further upside of Aussie pair.
- Clear break of 0.6900 could propel Aussie buyers toward Mid-February high, yearly peak.
- Fortnight-old support line, 200-EMA challenge AUD/USD bears before giving them control.
AUD/USD aptly portrays early Friday’s sluggish markets as it seesaws around 0.6880-90 while seeking fresh clues to challenge the four-month high marked the previous day. In doing so, the Aussie pair also justifies the overbought RSI (14) conditions as traders await more clues to confirm the US Federal Reserve’s (Fed) July rate hikes.
Also read: AUD/USD bulls take a breather at 16-week high below 0.6900 as Fed hawks retreat, more US data eyed
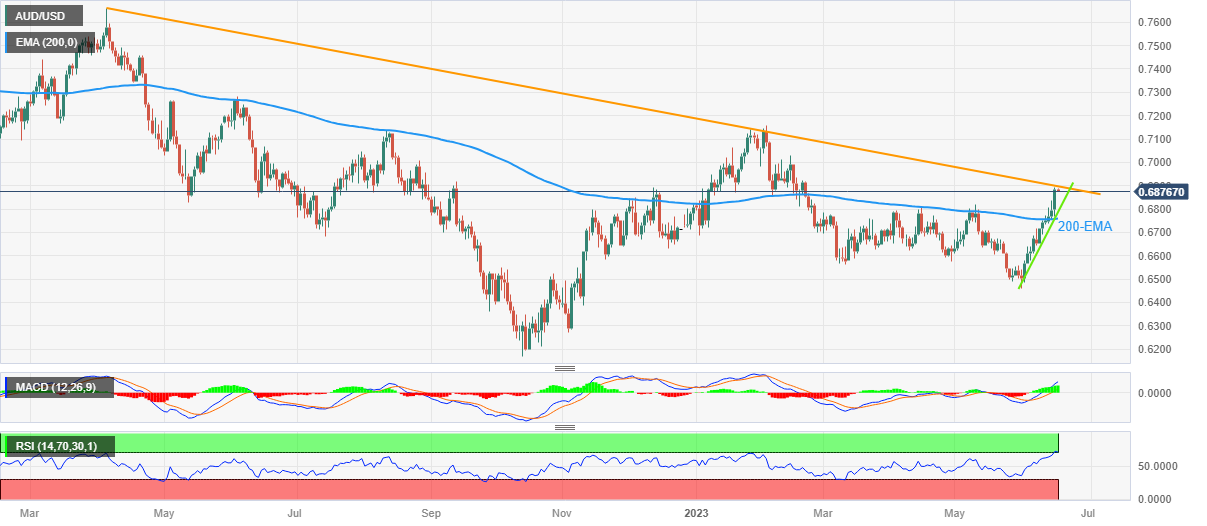
Elsewhere, failure to provide a daily closing beyond the key resistance line stretched from April 2022, close to the 0.6900 round figure by the press time, challenges the AUD/USD bulls, especially amid the overbought RSI.
However, the bullish MACD signals and the quote’s successful trading above the 200-day Exponential Moving Average (EMA), as well as an ascending support line stretched from early June, keeps the AUD/USD pair buyers hopeful.
That said, May’s high of 0.6820 appears the short-term important support to watch for the intraday sellers of the AUD/USD pair.
Following that, the aforementioned immediate support line and the 200-EMA, respectively near 0.6785 and 0.6760, will be in the spotlight.
On the flip side, a daily closing beyond the previously mentioned multi-month-old resistance line will need validation from the February 20 swing high of around 0.6920 and the 0.7000 psychological magnet to convince the bulls to aim for the mid-February 2023 peak of 0.7030.
Should the AUD/USD buyers manage to cross the 0.7030 hurdle, the odds of witnessing a run-up toward the yearly peak of 0.7157 can’t be ruled out.
AUD/USD: Daily chart
Trend: Pullback expected