Silver Price Analysis: XAG/USD recovery falters despite falling bond yields, sellers in charge
- XAG/USD sees resistance, trading at $23.82, down 0.36% amidst weakened US Treasury yields.
- Despite the downward tilt, breaking June 9 daily high could shift Silver’s bias to neutral upwards.
- Oscillators predict near-term downside, indicating sellers’ continued market control.
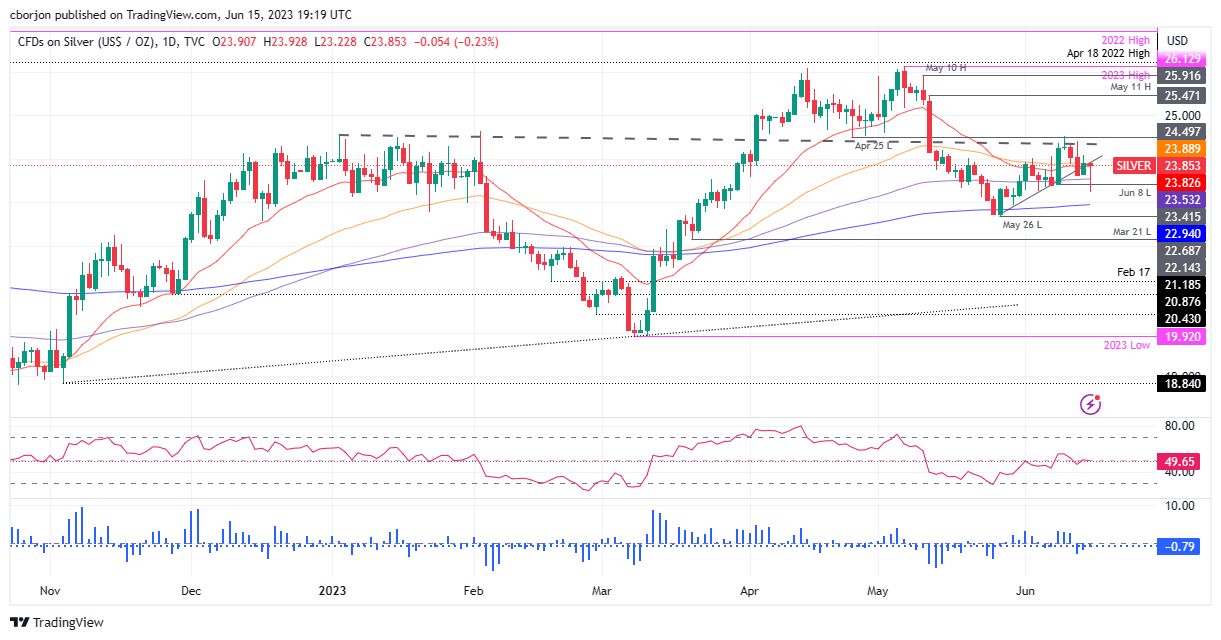
Silver price erases some of its earlier losses which witnesses XAG/USD’s printing a two-week low at $23.22 before reversing its direction. However, XAG/USD’s recovery stalled at a resistance area, with several technical indicators capping the uptrend. At the time of writing, the XAG/USD is trading at $23.82, down 0.36%.
XAG/USD Price Analysis: Technical outlook
The XAG/USD remains neutrally biased, tilted downwards as the white metal can’t reclaim the April 25 swing low of $24.49, an inflection point that can pave the way for further upside. Should be said Silver failed to rally, despite a drop in US Treasury bond yields. Therefore, XAG/USD’s momentum in the short term could be fading, warranting a bearish resumption.
To the downside, XAG/USD would find first support at the 100-day Exponential Moving Average (EMA) at $23.53, which, once cleared, would put at risk $23.00. Break below, and the 200-day EMA will be up for grabs at $22.94 before challenging May 26 low at $22.68, with further downside expected past the latter.
Conversely, the XAG/USD must crack the June 9 daily high for a bullish resumption at $24.52. The break above will put into play a higher trading range and shift Silver’s bias to neutral upwards. The next resistance would be $25.00, followed by May 11 high at $25.47.
However, oscillators suggest further downside expected in the near term, with the Relative Strength Index (RSI) at a bearish area and the three-day Rate of Change (RoC), portraying sellers remaining in control.
XAG/USD Price Action – Daily chart

